


Erstellen Sie eine Wetterstation mit Raspberry Pi und DHT22

Globaler Lieferant elektronischer Komponenten AMPHEO PTY LTD: Umfangreiches Inventar für One-Stop-Shopping. Einfache Anfragen, schnelle, individuelle Lösungen und Angebote.
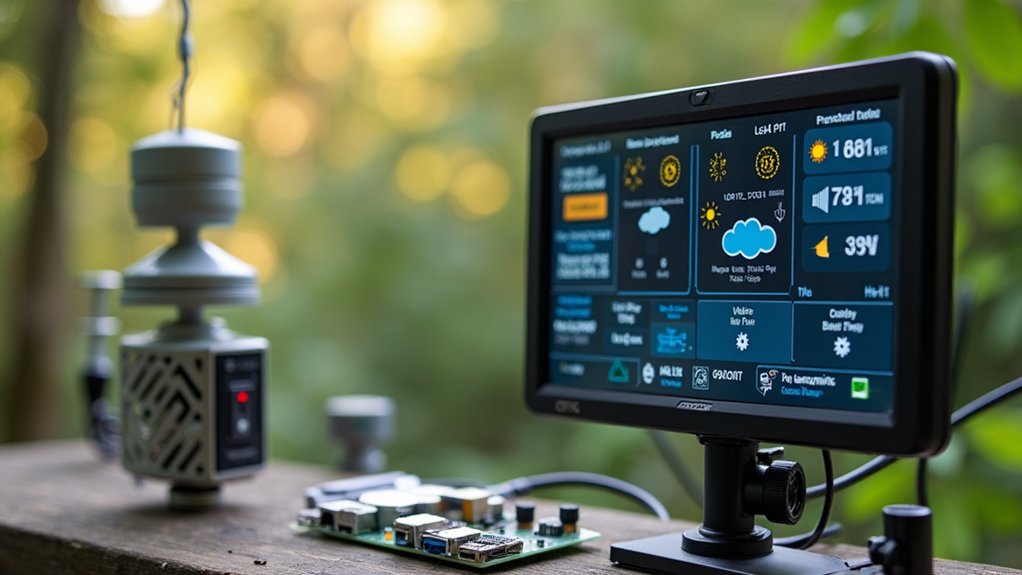
Hier ist eine saubere, ganzheitliche Möglichkeit, eine Raspberry Pi + DHT22-Wetterstation zu erstellen, die Daten protokolliert und ein winziges Web-Dashboard bedient.
1) Was du brauchst
-
Raspberry Pi (jedes Modell mit GPIO; Pi 3/4/5 empfohlen)
-
microSD-Karte mit Raspberry Pi OS
-
DHT22 (auch als AM2302 bekannt). Beim nackten Sensor zusätzlich einen 10-kΩ-Pull-Up-Widerstand einplanen.
-
Breadboard + Jumperkabel
-
(Optional) DHT22-Module enthalten oft bereits den Pull-Up—dann brauchst du keinen extra Widerstand.
2) Verdrahtung (3,3-V-Logik!)
DHT22-Pinbelegung (links→rechts, wenn du auf die Gitter/Schlitze schaust):
-
VCC
-
DATA
-
(NC) – nicht belegt
-
GND
Anschluss am Pi:
-
DHT22 VCC → Pi 3,3 V (Pin 1)
-
DHT22 GND → Pi GND (Pin 6)
-
DHT22 DATA → Pi GPIO4 (BCM 4, Pin 7)
-
Beim nackten DHT22: 10-kΩ zwischen VCC und DATA als Pull-Up
DHT22-Spezifikation: nicht schneller als alle 2 Sekunden auslesen.
3) OS-Vorbereitung & Bibliotheken installieren
4) Schnelltest-Script
Erstelle dht_test.py:
Start:
Wenn alle ~2 s Werte erscheinen, passt es.
5) In CSV protokollieren (für Diagramme/Analysen)
Projektordner anlegen:
Erstelle dht_logger.py:
Lass es ein paar Minuten laufen:
Mit Strg+C stoppen.
6) Autostart beim Booten (systemd)
Service anlegen:
Einfügen:
Aktivieren:
7) Mini-Web-Dashboard (Flask + HTML)
Zeigt den aktuellsten Wert und einfache Diagramme aus der CSV.
Erstelle server.py:
Erstelle index.html (neben server.py ablegen):
Server starten:
Vom anderen Gerät öffnen: http://<pi-ip>:8080/
(Optional) Als Service einrichten:
8) Tipps, Genauigkeit & Fehlersuche
-
Abtastrate: DHT22 ist langsam; nicht schneller als alle 2 s auslesen.
-
Spannung: 3,3 V verwenden. 5 V gefährden die Pi-GPIOs.
-
Pull-Up: Nackter DHT22 braucht 10 kΩ an DATA. Module haben ihn meist schon.
-
Fehlwerte/Spitzen: Bei DHT-Sensoren normal—Code sollte
NoneoderRuntimeErrorabfangen (siehe oben). -
Berechtigungen: Bei Kanten-/GPIO-Rechten sicherstellen, dass
libgpiod2und CircuitPython DHT installiert sind (siehe Schritte). -
Platzierung: Nicht in direkte Sonne und weg vom warmen Pi-Luftstrom für realistischere Raumwerte.
-
Einheiten: °F:
temp_f = temp_c * 9/5 + 32.
Verwandte Artikel
- ·Wie installiert man Windows 11 auf Raspberry Pi?
- ·Welche Sprache ist am besten für Robotik, IoT, KI, Spiele oder Web-Apps?
- ·Raspberry Pi Pico vs Arduino Nano vs STM32 Blue Pill vs ESP32 vs STM32 Black Pill | Vergleich
- ·Kann das Raspberry Pi mit Batterien betrieben werden?
- ·Wie nutzt man Arduino für IoT-Anwendungen?
- ·Wie erstelle ich ein physisches Mikrocontrollerprojekt mit nuller Grundlage?
- ·Warum sind 4-Bit-Mikrocontroller noch nicht abgeschafft?
- ·An welche Display-Geräte kann sich das Raspberry Pi anschließen?
- ·Wie benutzt man Beschleunigungsmesser mit Arduino?